Since important policy decisions regarding Ask Ubuntu's scope are taken using voting in Ask Ubuntu Meta, it's important that as many people as possible participate in the discussion related to changing policies of Ask Ubuntu in Ask Ubuntu Meta (by voting/commenting/some other way). (Something related: What is considered a community consensus on Meta?)
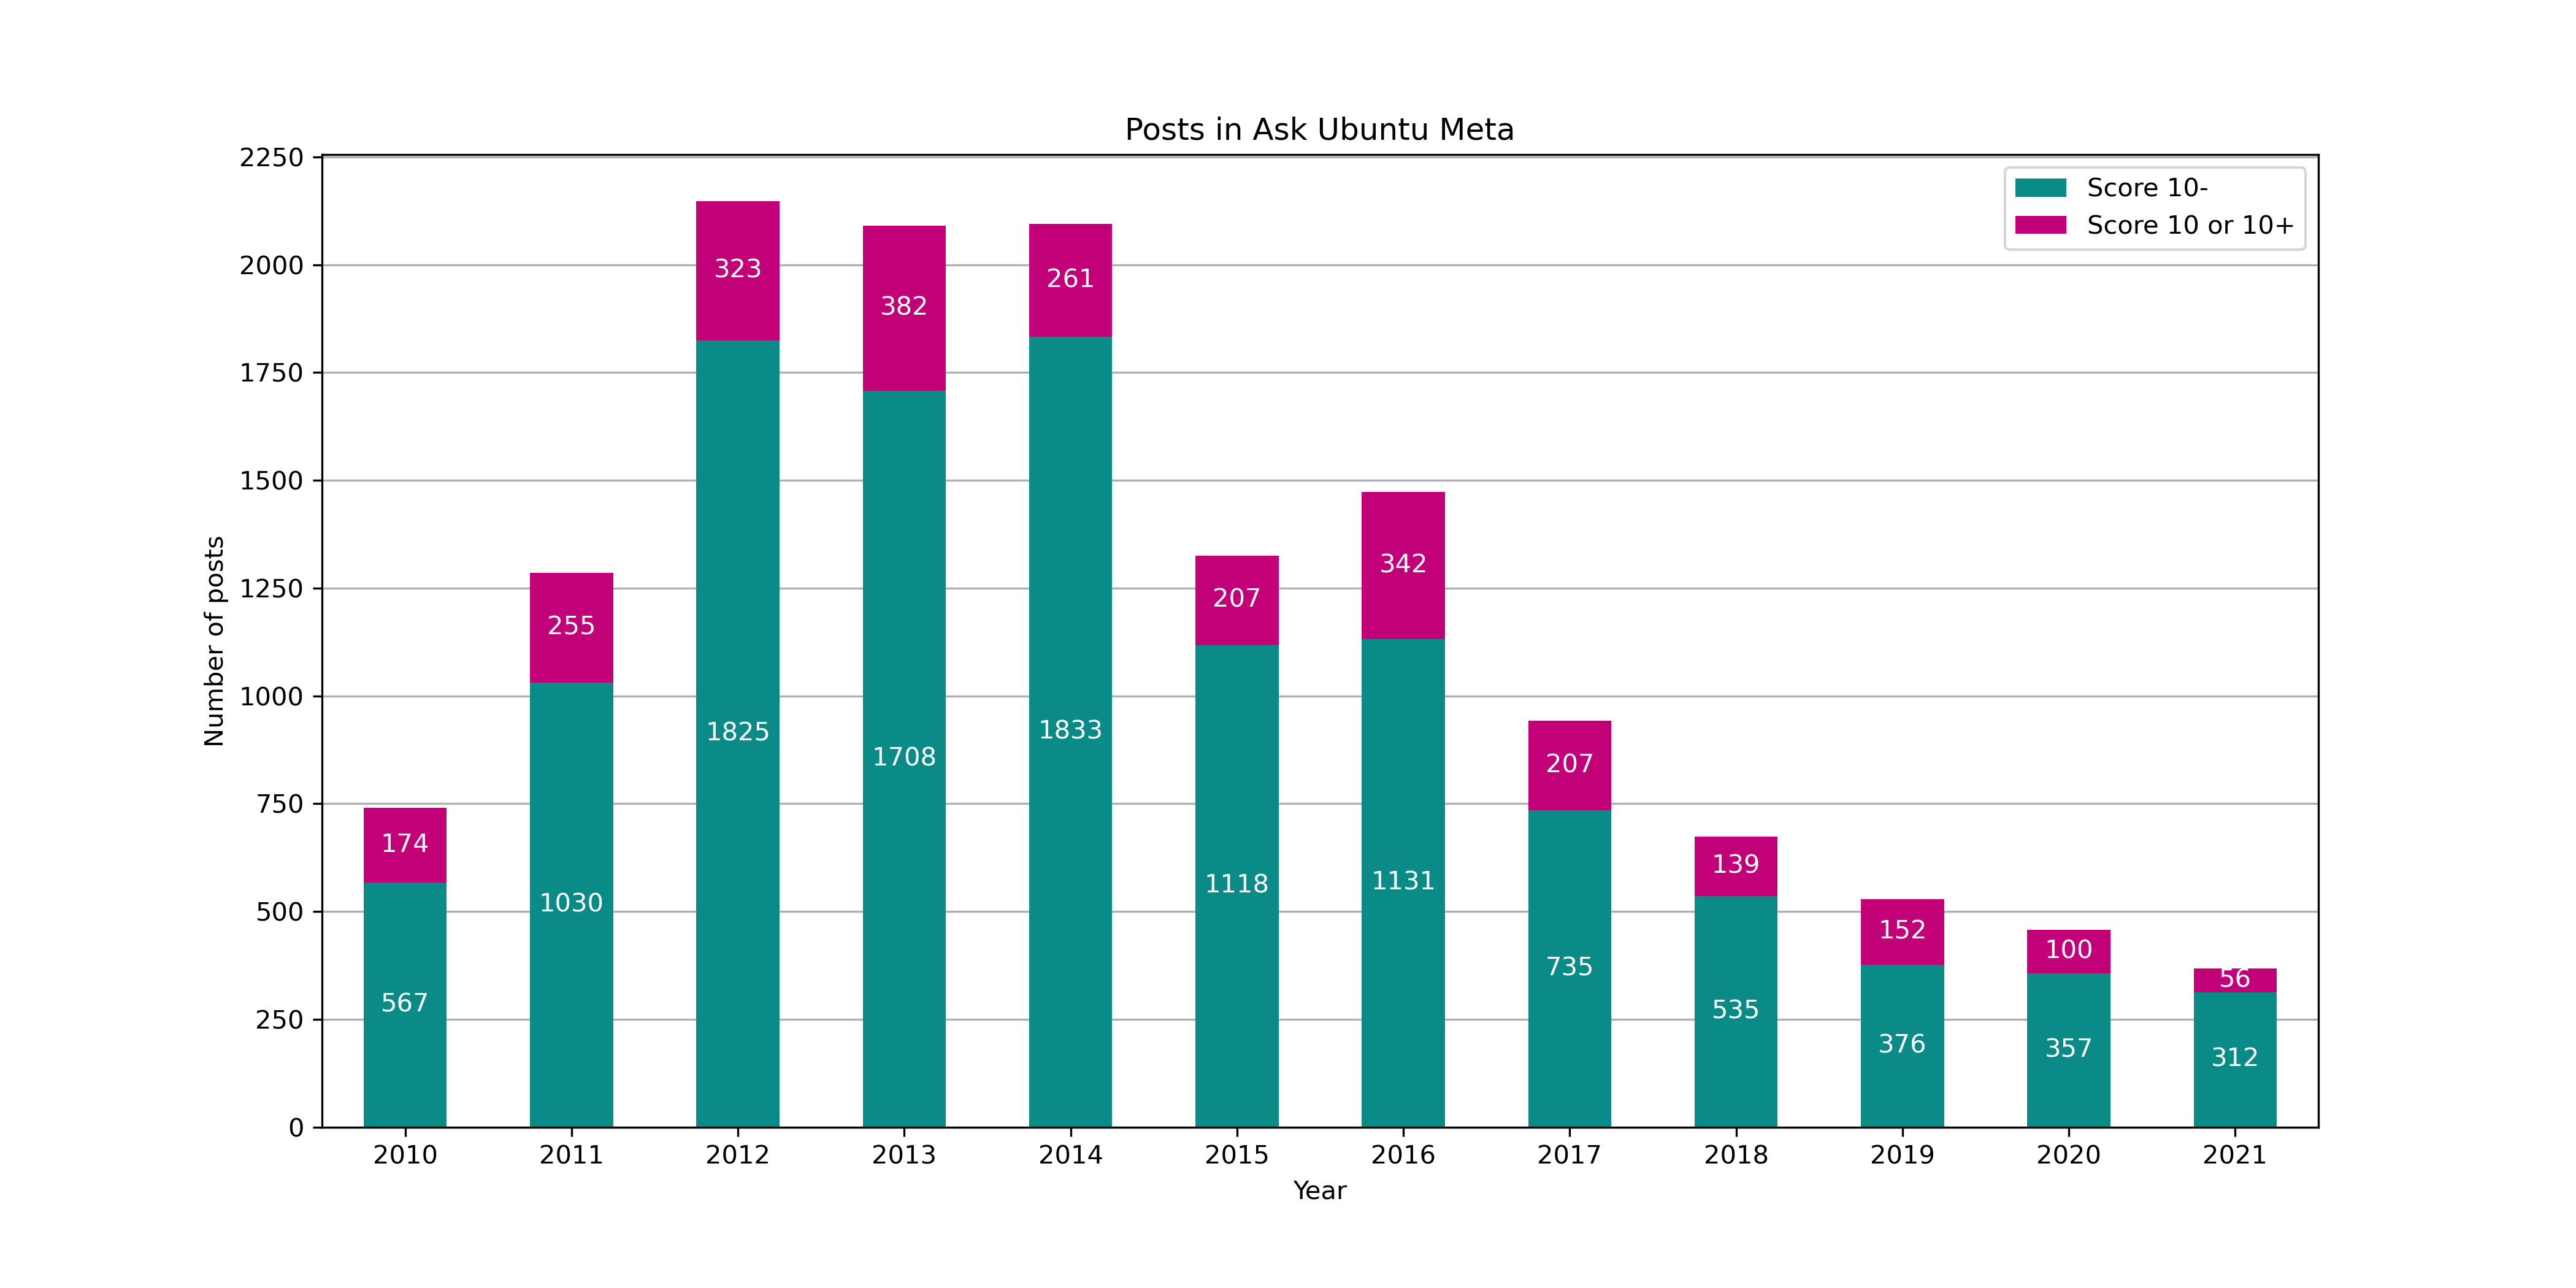
I created some SEDE queries to get the total number of posts per year and the number of posts per year with a score more than 10 in Ask Ubuntu Meta. You can check the results here:
| Year | Total | Score 10+ | Score 10+ as % of total | Score 10- |
|---|---|---|---|---|
| 2010 | 741 | 174 | 23.4818 | 567 |
| 2011 | 1285 | 255 | 19.8444 | 1030 |
| 2012 | 2148 | 323 | 15.0372 | 1825 |
| 2013 | 2090 | 382 | 18.2775 | 1708 |
| 2014 | 2094 | 261 | 12.4642 | 1833 |
| 2015 | 1325 | 207 | 15.6226 | 1118 |
| 2016 | 1473 | 342 | 23.2179 | 1131 |
| 2017 | 942 | 207 | 21.9745 | 735 |
| 2018 | 674 | 139 | 20.6231 | 535 |
| 2019 | 528 | 152 | 28.7879 | 376 |
| 2020 | 457 | 100 | 21.8818 | 357 |
| 2021 | 368 | 56 | 15.2174 | 312 |
Here are the above results as a graph to make things more clear:
[Credits to BeastOfCaerbannog for the nice graph! If you are interested to make the graph on your own, you can refer the code used by me: https://paste.debian.net/1236724/ (once again credits to BeastOfCaerbannog!)]
Note: The data might change a bit if the old posts get upvotes/downvotes.
There were days in Ask Ubuntu Meta when posts (which are not even related to policy decisions) had chances of getting more than 70 votes. [Example (excellent answer by Zanna)... Gone are those days!]
The recent policy change proposal just got approximately only 40 votes and this is sad to see. The 10 years anniversary post got more votes than it.
I might be judgemental to compare the state of Ask Ubuntu Meta just based on votes. But I feel that the active users of Ask Ubuntu Meta do know that other forms of interaction (like comments, answers) too have decreased substantially in the recent past.
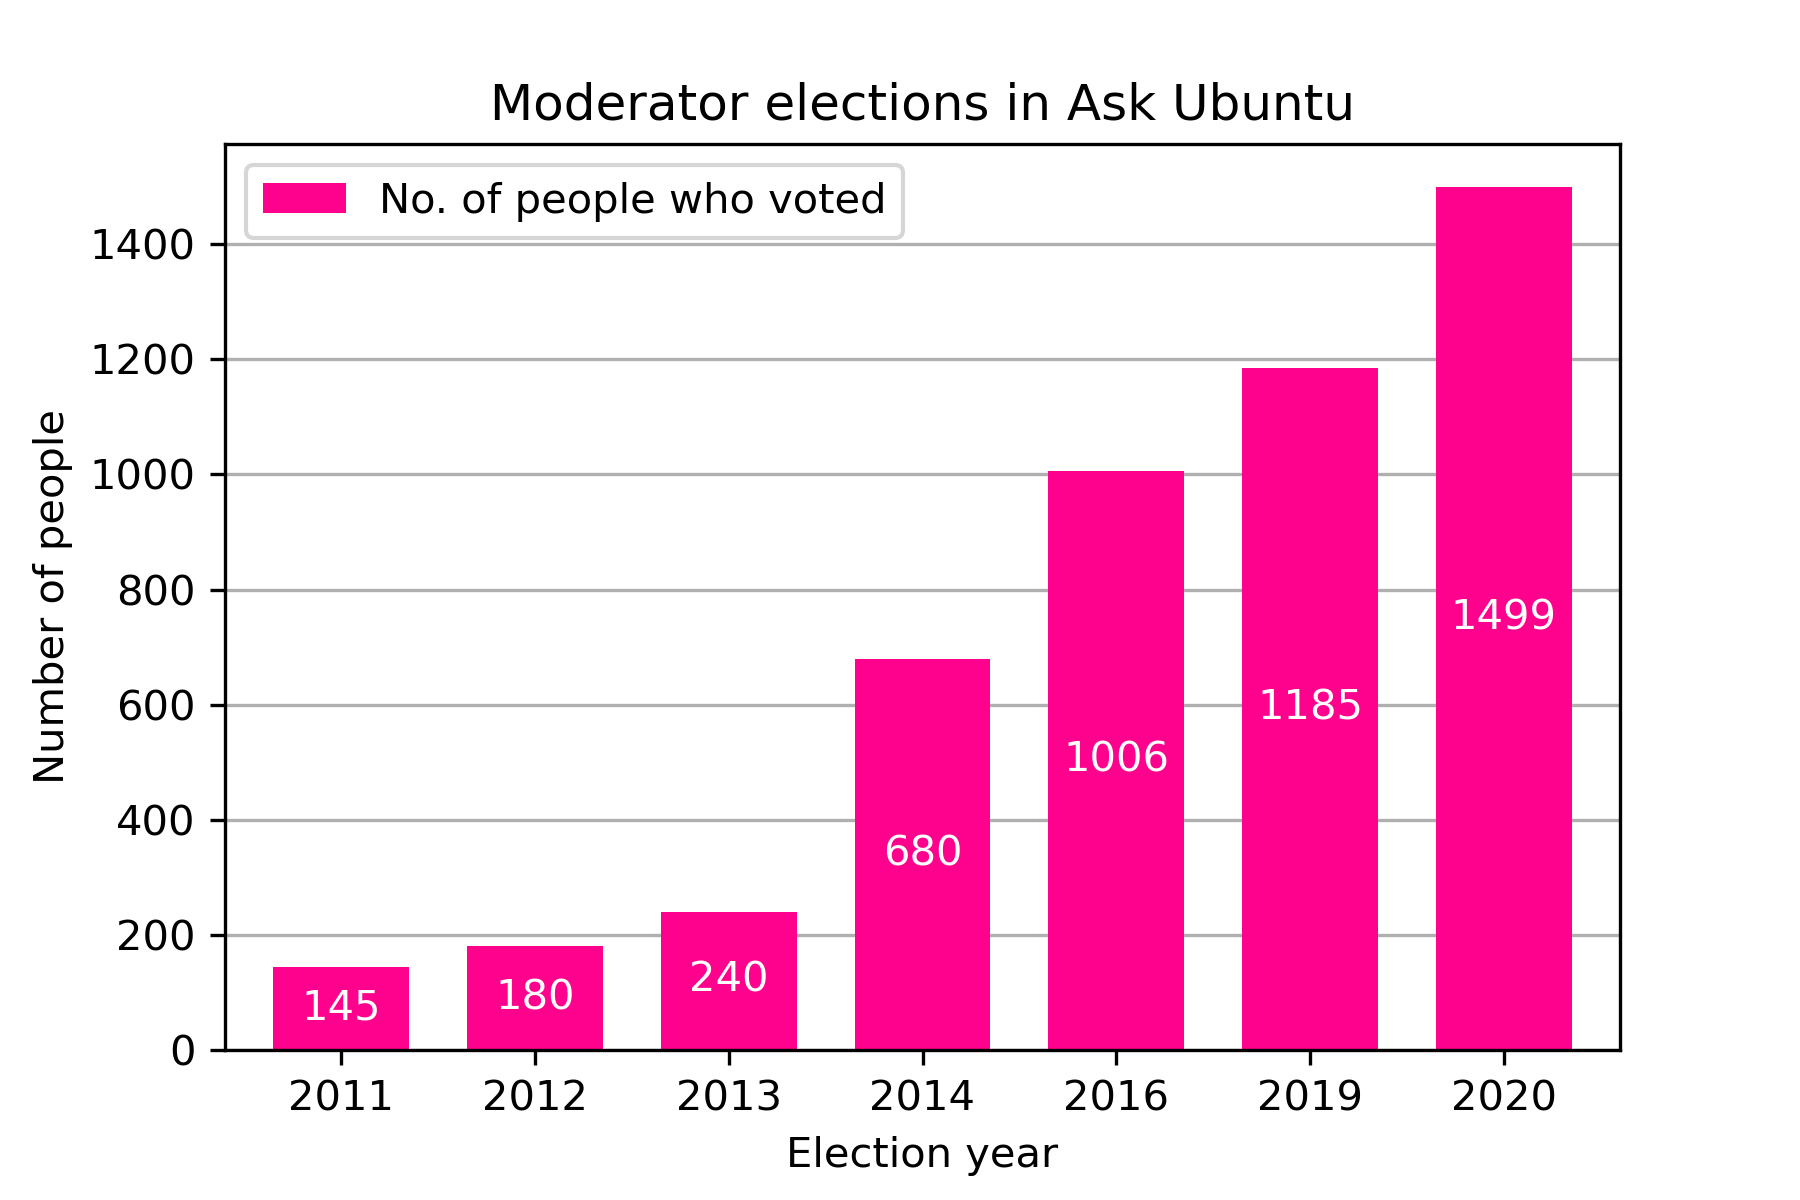
Thinking about votes in meta made me think about election statistics. The reason why I thought to look into election statistics is because I thought that voting can be considered as a metric to determine community participation in taking important decisions for the community (i.e., in this case, choosing a moderator).
I could not find any SEDE data about this (or I didn't search properly). So, I found the data manually from https://askubuntu.com/election.
| Election year | Number of people who voted |
|---|---|
| 2011 | 145 |
| 2012 | 180 |
| 2013 | 240 |
| 2014 | 680 |
| 2016 | 1006 |
| 2019 | 1185 |
| 2020 | 1499 |
Let's look at the data graphically:
After looking into the data, these are the questions which I have:
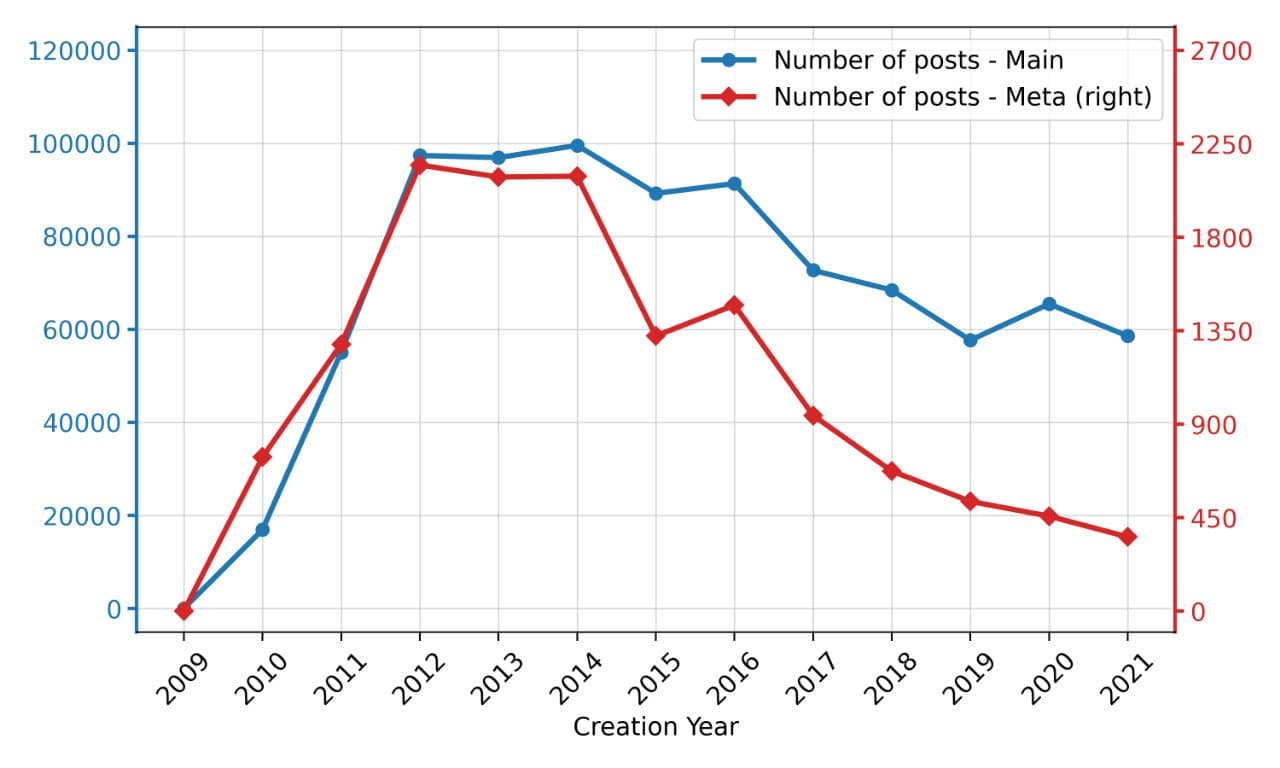
We can clearly see a huge growth in the number of people who voted in the election since the past few years. But votes in meta have decreased over the past few years. Does this indicate that there is no correlation between these two facts?
There is a complaint being raised by some users regarding accepting the policy change as the votes were low. How do we deal with the issue of declining participation in Ask Ubuntu Meta? Should we perhaps have the featured tag for more than a month for posts regarding a policy change? Should we invite more people to meta? (and how do we invite them?)
As of creating this post, I have never participated in an election. According to information shared by a fellow user, I got to know that notifications are sent to users regarding the election.
So, wouldn't it be a good idea to send notifications to users regarding voting in policy change proposals in meta? Maybe the staff can help with that.
Another issue could be the fact that meta is hard to find. So how can it be made more accessible? There have been some requests made in Meta Stack Exchange regarding this (which are worth checking out):
- https://meta.stackexchange.com/a/367982
- Rename "Feedback" to "Meta" in footer (Sorry for self promotion 😅)


