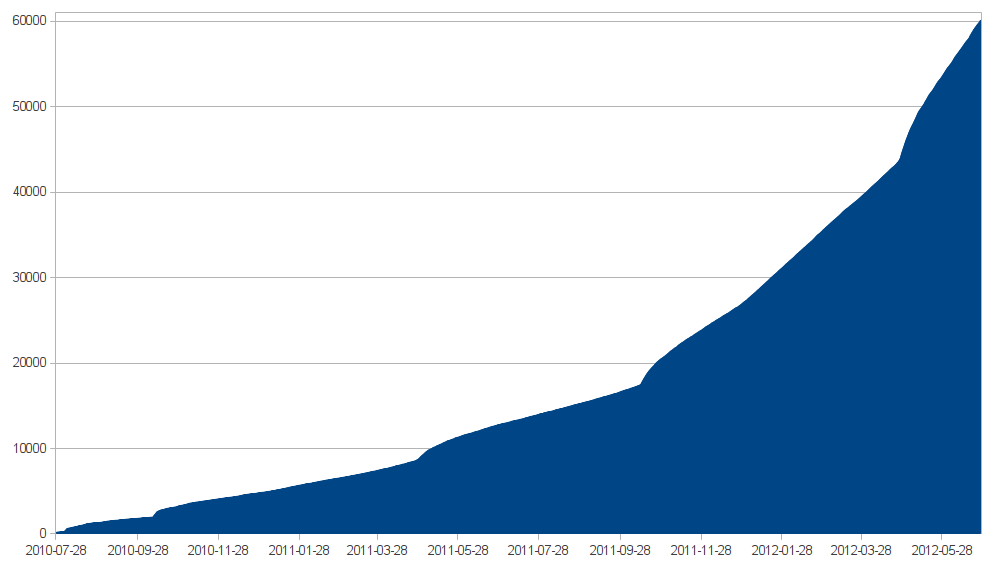
We have tools to show this in our moderator section but as we're not allowed to show you any of the detail in there (of which this probably counts) I built you a query on data.stackexchange.com:
Those are the "new user" counts for each day. If you want a running total, you'll need to build something that accumulates a running total (fairly simple, either in a script or a spreadsheet).
Note: the data on that site isn't live. The latest data on there at the moment is from the end of June. They do dumps every few months.
Can I see the graph when it's done?
##Edit: Got bored; made a graph.

You can download the spreadsheet from:
